Diving Deeper into DAX: From Fundamentals to Complex Scenarios in Power BI

Category :Power BI
Published on: 20-03-2024
Understanding DAX with Power BI allows you to gain unmatched insights and efficiency in the field of data analysis. With the use of sophisticated capabilities like calculated columns and temporal intelligence, this introduction demonstrates the transformative power of DAX through real-world applications. In this blog we explore the core of DAX, adding dynamic data storytelling and advanced analytics to your Power BI reports.
Basic Operations and Functions in DAX
Power BI's DAX (Data Analysis Expressions) is a formula language that elevates data analysis to new heights. This guide takes you from understanding basic operations and functions to applying DAX in sophisticated, real-world scenarios.
DAX enables various operations for data analysis:
- Arithmetic operations: +, -, *, / for basic math
- Text functions: CONCATENATE, LEFT, RIGHT, LEN for manipulating strings.
- Date functions: DATE, DATEDIFF, YEAR, MONTH to work with dates.
- Logical functions: IF, AND, OR, NOT for conditional logic.
Understanding these foundational elements is key to harnessing the full power of DAX. Beyond basic calculations, DAX is instrumental in:
- Time Intelligence: Calculating time-based data, such as year-to-date sales.
- Aggregation functions: Summarizing data, like total sales across different regions
- Filtering: Refining data sets based on specific criteria.
- Data Modeling: Enhancing data models with calculated columns and measures.
Scenarios
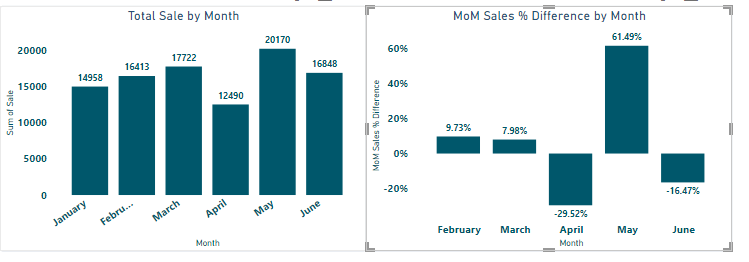
Scenario 1: Sales Growth Month-over-Month
Sales Data
| Date | Total Sales | Customer ID | Purchase Frequency |
|---|---|---|---|
| 01-01-2023 | 1200 | C001 | Frequent |
| 15-01-2023 | 800 | C002 | Occasional |
| 01-02-2023 | 1500 | C001 | Frequent |
| 18-02-2023 | 700 | C003 | Occasional |
| 01-03-2023 | 1600 | C001 | Frequent |
| 20-03-2023 | 900 | C002 | Occasional |
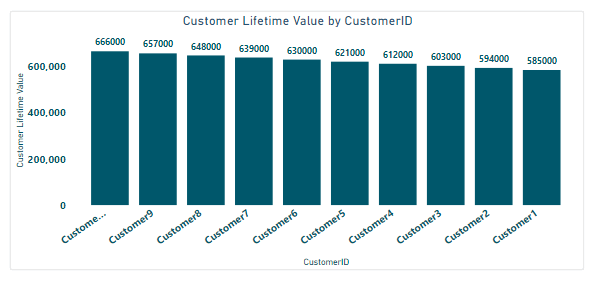
Scenario 2: Calculating the Customer Lifetime Value
Sample Data
| Sales ID | Customer ID | Sale Amount | Purchase Date |
|---|---|---|---|
| 1 | Customer 1 | 100 | 01-01-2023 |
| 2 | Customer 2 | 105 | 03-01-2023 |
| 3 | Customer 3 | 110 | 05-01-2023 |
| 4 | Customer 4 | 115 | 07-01-2023 |
| 5 | Customer 5 | 120 | 09-01-2023 |
Objective: Determine the percentage growth in sales compared to the previous month.
Simplified Logic:
Sales Difference MoM = Sale value (Current Month) – Sale value (Previous Month) Growth MoM = Sales Difference MoM / Sale value (Previous Month) * 100
DAX Query
MoM Sales % Difference =
VAR CurrentMonthIndex = MAX(('Table'[Month no]))
VAR PreviousMonthSales = CALCULATE(
SUM('Table'[Sale]),
FILTER(
ALL('Table'),
VALUE('Table'[Month no]) = CurrentMonthIndex - 1
)
)

VAR CurrentMonthSales = SUM('Table'[Sale])
RETURN
IF(
PreviousMonthSales = 0 || ISBLANK(PreviousMonthSales),
BLANK(),
(CurrentMonthSales - PreviousMonthSales) / PreviousMonthSales
This calculation shows the growth in sales by comparing the total sales of the current month against the previous month.
SAMPLE VISUAL:
Simplified Logic
Gather Basic Metrics: Calculate the total revenue from all sales, count the total number of purchases, and identify the number of unique customers.
Calculate Per-Transaction and Per-Customer Averages: Determine the Average Purchase Value (APV) by dividing total revenue by the number of purchases, and calculate the Purchase Frequency (PF) as the average number of purchases per customer.
Estimate Customer Value (CV): Multiply APV by PF to find the average monetary value each customer contributes through their purchases.
Assess Customer Engagement Duration: Identify the earliest and latest purchase dates to calculate the total active days, then divide by the number of customers to get the Average Customer Lifespan (ACL).
Compute Customer Lifetime Value (CLV): Multiply the Customer Value by the Average Customer Lifespan to estimate the total value a customer is expected to bring over the entirety of their relationship with the company.
Customer Lifetime Value =
VAR TotalRevenue = SUM('Sheet1'[SaleAmount])
VAR TotalPurchases = COUNT('Sheet1'[SaleID])
VAR TotalCustomers = DISTINCTCOUNT('Sheet1'[CustomerID])
VAR APV = DIVIDE(TotalRevenue, TotalPurchases)
VAR PF = DIVIDE(TotalPurchases, TotalCustomers)
VAR CV = APV * PF
VAR FirstPurchaseDate = CALCULATE(MIN('Sheet1'[PurchaseDate]), ALL('Sheet1'[SaleAmount]))
VAR LastPurchaseDate = CALCULATE(MAX('Sheet1'[PurchaseDate]), ALL('Sheet1'[SaleAmount]))
VAR TotalDays = DATEDIFF(FirstPurchaseDate, LastPurchaseDate, DAY)
VAR ACL = DIVIDE(TotalDays, TotalCustomers)
VAR CLV = CV * ACL
RETURN
This complex formula categorizes customers into VIP, Regular, or Casual based on their purchase frequency, offering deep insights for targeted marketing strategies
SAMPLE VISUAL:
Conclusion
Mastering DAX in Power BI is super helpful for anyone working with data. Just like learning special SQL tricks can make finding and understanding information easier, getting good at DAX means you can do cool things with your data in Power BI. At In22labs, we use these skills all the time. We make data load faster, figure out stuff by looking at data in different ways, keep our queries simple, and get exactly the data we need. This makes it quicker to make smart decisions and helps our business do better.
Tags
- DAX Fundamentals
- Calculated Columns
- Data Modeling
- Sales Analysis
- Customer Segmentation
- Business Intelligence
- Data Storytelling
- Advanced Analytics
- Data Transformation
- DAX Operations
- DAX Functions
- In22labs
- PowerBI
- Data Analytics
- e-governance
- Share this blog
-

-

-

-

-
0

- 3
You May Also Like

15-03-2024

08-03-2024


04-03-2024


12-02-2024


AI Chatbot for Statewide Disability Survey in Tamil Nadu: TN-RIGHTS Project funded by World Bank
Chatbot
20-01-2024


Big Data Processing with Apache Spark — the last journey through a fragmented data world
Data Analytics
12-01-2024

05-01-2024

19-02-2024


10-02-2024


24-01-2024

07-02-2024


08-05-2024

Artificial Intelligence (AI) Prompts: Simplifying Content Creation
Artificial Intelligence
09-05-2024